


What Is Temperature Uniformity (and Why It’s Different from Stability and Accuracy)
Temperature uniformity is the maximum temperature difference between the hottest and coldest measurement points within a chamber’s working volume at steady state. It answers one question: does every sample inside the chamber experience the same thermal conditions?
It is often confused with two related but distinct parameters:
| Parameter | What It Measures | Typical Specification |
|---|---|---|
| Uniformity (Spatial) | Temperature variation across different locations in the workspace | ±1°C (precision lab oven) to ±10°C (large industrial dryer) |
| Stability (Temporal) | Temperature variation at a single point over time | ±0.3°C to ±0.5°C at steady state |
| Accuracy | Difference between the indicated setpoint and the actual temperature at the control sensor | ±0.1°C to ±0.3°C display resolution |
Think of it this way: accuracy tells you whether the thermostat is telling the truth. Stability tells you whether it holds that truth over time. Uniformity tells you whether every corner of the chamber gets to hear it.
In practice, these three parameters interact. A chamber can have excellent accuracy and stability at the control sensor, while uniformity problems mean samples 30 centimeters away are baking at a different temperature entirely. For engineers specifying or operating thermal equipment, uniformity is often the parameter that matters most — because it is the one that determines whether every part, every sample, and every batch comes out the same.
AMS 2750, the aerospace pyrometry standard, classifies furnace uniformity from Class 1 (±3°C) to Class 6 (±28°C). That range underscores how dramatically uniformity requirements vary by application. A precision laboratory oven and a large industrial curing line operate in different universes of expectation. Understanding which universe you are in is the first step.
| Parameter | Definition | What Happens When It Fails | Typical Benchmark |
|---|---|---|---|
| Uniformity (Spatial) | Maximum temperature difference across the working volume | Samples at different positions experience different thermal histories — batch inconsistency, partial curing, unreliable test data | ±1°C to ±10°C depending on application |
| Stability (Temporal) | Temperature fluctuation at a single point over time | Process drift during long-duration tests, invalid accelerated life predictions | ±0.3°C to ±0.5°C |
| Accuracy | Difference between setpoint and actual temperature at the sensor | Systematic offset in all temperature readings, calibration drift | ±0.1°C to ±0.3°C display |
The Real Cost of Poor Temperature Uniformity
Temperature non-uniformity is not a tolerable margin of error — it is a structural defect that systematically erodes product quality, regulatory standing, and operating margins. Understanding the full scope of its impact transforms uniformity from a spec-sheet checkbox into a business priority.
Product Quality Failures Across Industries
The consequences of poor uniformity are industry-specific, but the pattern is universal: uneven heating produces uneven results, and uneven results produce waste.
In pharmaceutical manufacturing, temperature uniformity during drying directly controls moisture content uniformity across a tablet batch. A documented case from the r/pharma community described a facility where tablets near the air inlet measured 2.1% moisture while those far from it measured 4.8%. That gap put the batch well outside the FDA-required uniformity envelope. The outcome: 100,000 tablets scrapped, a production line shutdown, and a quality audit investigation. After upgrading to a forced-convection system with proper airflow design and sealing, moisture uniformity improved to ±0.3% and drying time dropped from 8 hours to 5 hours.
In aerospace composites curing, temperature uniformity within ±3°C to ±5°C across the entire cure envelope is required to achieve specified fiber-matrix adhesion. A 5°C cold spot in an autoclave can produce a laminate section with incomplete resin cross-linking. The defect is invisible to the naked eye but catastrophic in service. AMS 2750 Class 2 (±6°C) is the typical minimum for composite cure applications.
In electronics reliability testing, thermal aging and burn-in at non-uniform temperatures corrupt accelerated life test predictions. When one PCB zone experiences systematically different thermal stress, failure mode analysis becomes meaningless — the data points to problems that do not exist while hiding ones that do.
Regulatory Compliance and Audit Risk
Temperature uniformity is not just an engineering concern. It is a regulatory requirement embedded in international standards that carry legal and commercial weight.
IEC 60068-3-7:2020, the international standard for temperature chamber measurements, governs how uniformity is verified for environmental tests A (Cold) and B (Dry heat). Its 2020 revision made a critical change: the language shifted from “should” to “shall,” transforming uniformity verification from a recommendation into a requirement. Chambers that do not meet the specified uniformity criteria are no longer merely suboptimal. They are non-compliant.
For aerospace heat treatment, AMS 2750 mandates regular Temperature Uniformity Surveys (TUS) and System Accuracy Tests (SAT). Failure to maintain documented uniformity within the specified class can result in parts being rejected by OEM auditors, regardless of whether the parts themselves are defect-free. The paperwork matters as much as the performance.
In pharmaceutical stability testing, ICH Q1A requires documented temperature and humidity conditions throughout the storage volume. FDA 21 CFR Part 211.63 mandates that equipment used in drug manufacturing “shall be of appropriate design, adequate size, and suitably located to facilitate operations for its intended use.” Auditors interpret this general clause to include demonstrated temperature uniformity.
The common thread: if you cannot prove uniformity, you cannot prove compliance. And if you cannot prove compliance, you cannot ship.
Hidden Costs: Energy Waste, Throughput Loss, and Rework
Even when poor uniformity does not cause outright product failure, it imposes a quiet tax on operations.
When operators know a chamber has hot and cold zones, the instinctive response is to raise the setpoint temperature or extend the soak time as insurance. The logic is simple: ensure even the coldest zone meets the minimum requirement. This over-compensation increases energy consumption by an estimated 15% to 30%, depending on the severity of the non-uniformity and the insulation quality of the chamber.
Throughput suffers in parallel. Extending a 5-hour drying cycle to 8 hours to compensate for uneven heat distribution means 37.5% fewer batches per shift. Across a multi-chamber production line, this compounds into significant capacity loss.
Then there is rework. Parts that emerge from cold zones under-cured or from hot zones over-dried must either be scrapped or reprocessed. Each rework cycle consumes additional energy, labor, and production slot time. All the while, the root cause remains unaddressed.
Industry Standards and Benchmarks for Temperature Uniformity
If you are specifying or operating thermal equipment, the standard that governs your application determines everything: the uniformity you need, how you measure it, and how you prove it to an auditor. Start with the standard, then work backward to the chamber specification.
| Standard | Industry / Application | Uniformity Requirement | Test Method | Key Notes |
|---|---|---|---|---|
| IEC 60068-3-7:2020 | Environmental testing (electronics, automotive) | Chamber-dependent, verified via measurement | Loaded and unloaded measurement | 2020 revision changed “should” to “shall”; covers Tests A (Cold) and B (Dry heat) |
| AMS 2750 | Aerospace heat treatment | Class 1 (±3°C) to Class 6 (±28°C) | TUS + SAT | Requires periodic re-survey; documentation is auditable |
| GB/T 10586-2025 | Humidity/heat test chambers (China) | d1.5°C (-40 to +100°C); d2.0°C (+100.1 to +150°C) | Steady-state measurement with specified sensor grid | Updated 2025 edition; Chinese national standard for environmental chambers |
| ASTM E145 | Laboratory ovens and furnaces | Specified by oven class | Thermocouple grid mapping | Commonly referenced in NIST-traceable calibration |
| DIN 12880 | Laboratory ovens and incubators (EU) | Specified by device class | 9 to 27 thermocouple grid measurement | German standard; widely adopted across European testing labs |
| ICH Q1A | Pharmaceutical stability testing | ±2°C and ±5% RH typical | Temperature and humidity mapping | Required for drug product stability studies submitted to FDA/EMA |
A chamber that quotes ±1°C uniformity but has never been verified per the standard your industry requires is a compliance gap waiting to surface during an audit.
Four System-Level Factors That Determine Chamber Uniformity
A chamber’s datasheet uniformity number is the result — but it tells you nothing about whether the chamber will maintain that uniformity under real operating conditions, with real loads, over years of service. To evaluate uniformity properly, you need to look at the four subsystems that produce it.
Airflow Design — The Single Largest Influence
Air is the heat transfer medium in forced-convection chambers. How it moves determines where heat goes.
Forced convection systems, which use fans to actively circulate air through heating elements and across the working volume, typically achieve uniformity within ±2°C. Natural convection, where hot air rises passively with no mechanical assistance, can produce temperature differences of 5°C to 10°C between the top and bottom of the chamber. The difference is not subtle: it is the gap between a precision instrument and a heated box.
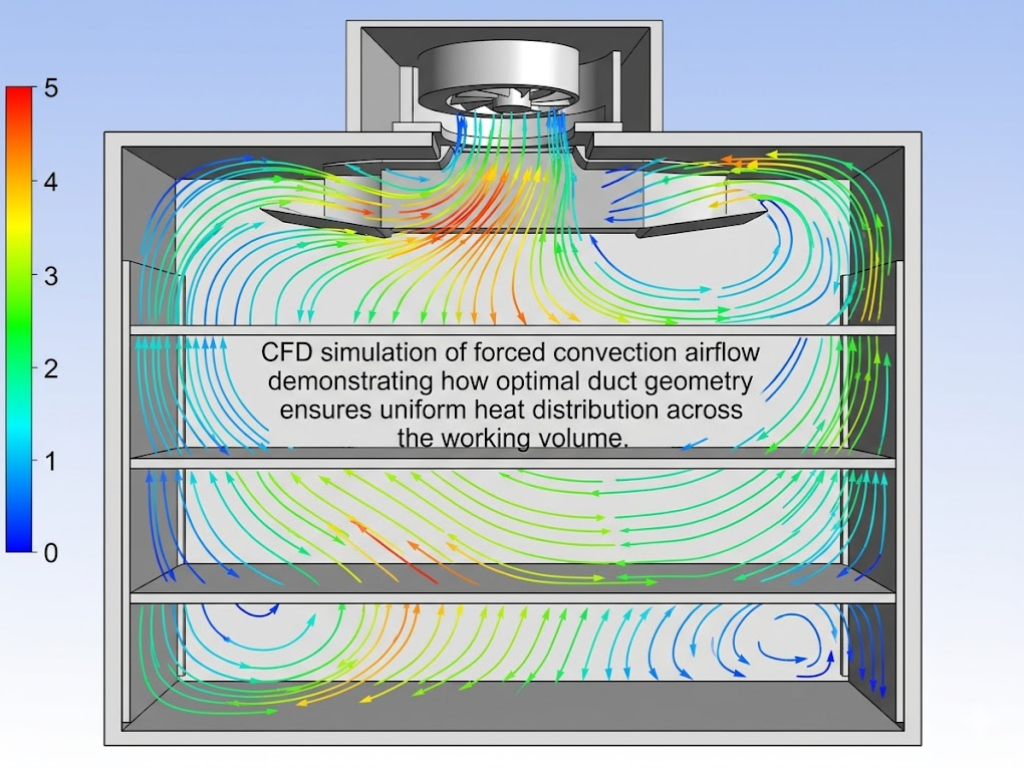
But forced convection alone is not enough. The quality of airflow design — fan placement, duct geometry, and air return path — determines whether the moving air actually reaches every corner of the working volume. High-end chambers use volute fan housings designed to Archimedean spiral principles, distributing air evenly across the heating elements before it enters the workspace. Return air plenums ensure that air leaving the chamber is captured and reconditioned, rather than creating pressure imbalances that pull in ambient air.
At the extreme of precision, chambers like the Thermo Scientific Forma 3960 series use horizontal laminar airflow through side plenums. A positive-pressure feed plenum on one side and a negative-pressure return on the other achieve uniformity as tight as ±0.3°C.
Insulation Quality and Thermal Boundary Integrity
Even the best airflow design cannot compensate for heat leaking through the walls. Insulation determines the thermal boundary condition at all six interior surfaces. Since the walls are the coolest surfaces in a heating chamber, they are also where cold spots originate.
Typical chamber insulation materials include mineral wool, polyurethane foam (PUF panels at 60 mm to 120 mm thickness, density e1 kg/cu.ft.), and aluminum silicate cotton. All are flame-retardant and dimensionally stable across the operating temperature range. Thicker insulation reduces wall heat loss, but the uniformity benefit is not linear: beyond approximately 100 mm, the incremental improvement is marginal for most applications.
More insidious than uniform wall losses are thermal bridges. These are points where the insulation is locally compromised. Cable ports, test access holes, and door frames all create paths of lower thermal resistance. A poorly sealed 2.4-inch (6.1 cm) cable port can produce a local temperature deviation of 3°C to 8°C near the penetration. That is a cold spot that airflow alone cannot fully correct.
Specimen Loading and Airflow Obstruction
The most common cause of uniformity problems is not a design flaw in the chamber. It is the way the chamber is loaded.
When specimens are packed densely, stacked against walls, or placed directly in front of supply and return vents, they disrupt the airflow pattern the chamber was designed to produce. The result is straightforward: zones with restricted airflow run hotter or colder than zones with free airflow.
Industry best practice, reflected in chamber manuals from manufacturers like ESPEC, recommends keeping total specimen volume below approximately one-third of the chamber’s internal volume. Individual specimens should maintain a minimum clearance of 50 mm from interior walls and 100 mm from air supply and return vents. Heat-dissipating specimens present an additional challenge. Powered electronics, LED arrays, and running motors inject heat locally and can create hot spots 5°C to 10°C above the setpoint if not accounted for in the chamber’s cooling capacity.
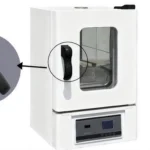
Sealing Integrity — The Factor Most Engineers Overlook
If airflow is the engine of uniformity and insulation is the chassis, sealing is the door that keeps the whole system closed. A compromised door seal creates a pressure differential between the chamber interior and the ambient environment. That differential pulls in cold ambient air at one edge while leaking heated chamber air at another. The result is a convection loop that neither the fan nor the heater can fully correct.
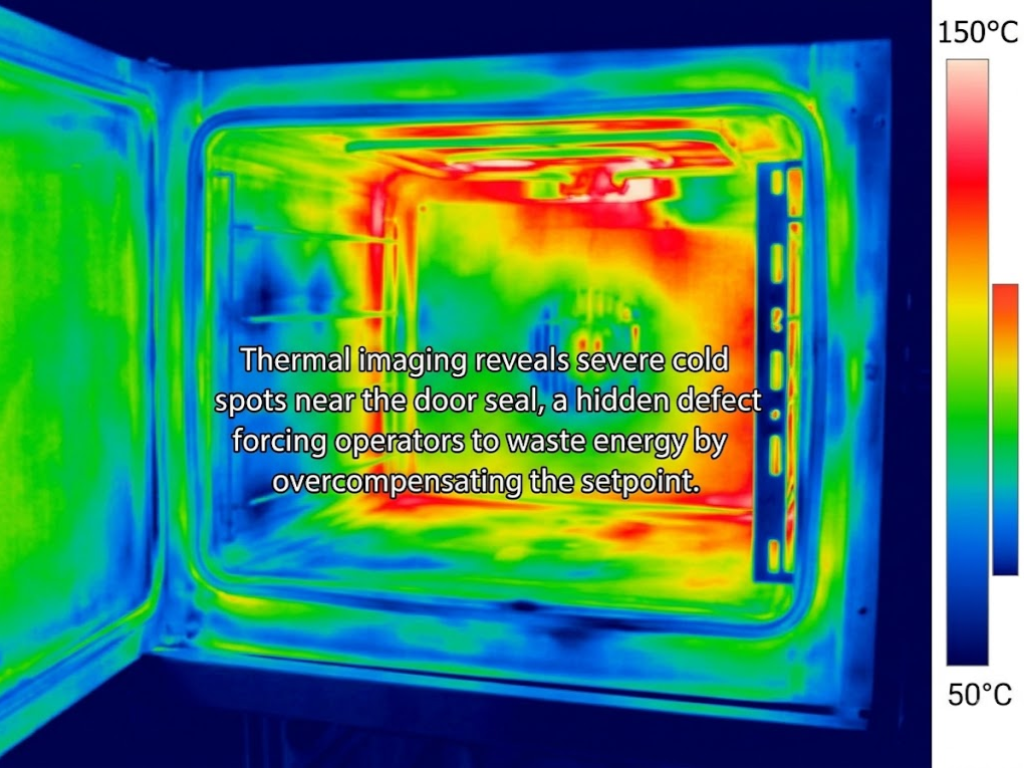
Signs of sealing failure are measurable before they are visible: power consumption rising more than 15% above historical average at high-temperature setpoints, temperature recovery time after door opening extending beyond 5 minutes longer than the original baseline, and frost formation in the test area during low-temperature operation.
The standard leak detection method is a differential pressure hold test: pressurize the chamber to approximately 500 Pa and verify that the pressure drop over 5 minutes does not exceed 50 Pa. For field troubleshooting, a soapy water solution (1:3 dish soap to water) applied to door seal edges and window frames reveals leaks through bubble formation. Thermal imaging at -40°C or +150°C provides the most detailed picture, revealing not just seal leaks but also hidden insulation failures within the chamber walls.
Silicone rubber door seals are the industry standard for environmental chambers, rated for continuous service from approximately -70°C to +260°C. For applications involving aggressive chemical exposure or extended sub-zero operation, fluoro-silicone seals offer a wider temperature range and superior chemical resistance.
But a seal is only as good as the hardware that holds the door against it. That brings us to the most overlooked factor in temperature uniformity.
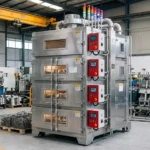
The Overlooked Factor: How Hardware Components Make or Break Uniformity
A test chamber’s temperature uniformity is ultimately determined the moment the door closes. The seal strip, the hinges that align it, the locks that compress it, and the access ports that penetrate it — these four hardware categories form a 360° defense against the thermal gradients that destroy uniformity. Any weakness in one of them opens a gap that no amount of airflow optimization can close.
Door Seals and Gaskets — The 360° Thermal Boundary
The door seal is the only component that spans the entire perimeter of the chamber’s largest opening. Its job is to maintain a continuous, uniform-pressure contact surface against the chamber body at every temperature the chamber operates at, from -70°C cold soak to +260°C dry heat.
Material selection is the first decision point. Standard silicone rubber seals cover the temperature range most chambers need. Fluoro-silicone upgrades extend chemical resistance for pharmaceutical and biomedical applications where alcohol-based cleaning agents are used. EPDM offers a cost-effective alternative for moderate temperature ranges but lacks the extreme-temperature capability of silicone.
Beyond material, structural design matters. Single-lip seals provide one line of contact; double-lip seals create a dual-barrier configuration that can improve edge-region temperature uniformity by an estimated 30% to 50% by trapping a static air pocket between the two lips. U-channel mounting designs distribute compression force more evenly than flat-adhesive seals, reducing the likelihood of localized gaps developing as the seal ages.
Seal maintenance is straightforward but often neglected. Silicone seals in high-frequency-use chambers (multiple door openings per day) typically require replacement every 2 to 3 years. Lower-frequency environments can extend this to 5 to 7 years. Replacement procedure matters: preheating a new seal at 60°C for 30 minutes before installation relaxes the material and ensures a uniform fit. Mounting screws should be tightened in diagonal order at approximately 1 Nm torque to prevent warping.
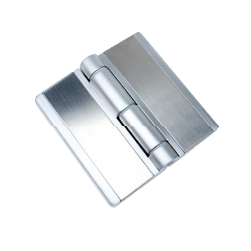
Hinges and Door Alignment — The Geometry of a Perfect Seal
A door seal can only perform to specification if the door meets the chamber body with uniform gap clearance around the entire perimeter. Hinges are the geometric foundation of that alignment. They are under constant mechanical stress.
A typical industrial test chamber door weighs over 100 kg. Over thousands of open-close cycles, gravity pulls the door downward, the hinge pins wear, and the door sags. A gap opens at the top corner opposite the hinge side. When that gap exceeds approximately 0.3 mm, the seal can no longer maintain uniform compression, and leakage begins.
The automotive analogy is apt: a car door with worn hinges produces wind noise at highway speed because the seal is no longer uniformly compressed. In a test chamber, the equivalent “wind noise” is a 3°C to 5°C temperature deviation at the leak point that grows worse over time.
High-load hinges rated for 20,000 or more open-close cycles are essential for chambers in production environments. Adjustable hinge designs allow maintenance teams to correct minor sag before it becomes a sealing failure. That field adjustment can extend both seal life and uniformity stability. The standard field check is a 0.1 mm feeler gauge: it should encounter slight, uniform resistance when drawn around the entire closed door seam. Any position where the gauge passes freely indicates a misalignment that requires correction.
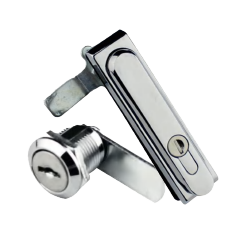
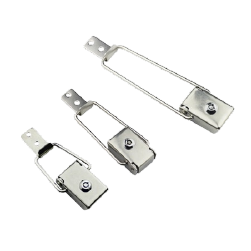
Compression Locks and Latching Mechanisms — Sustained Sealing Force
The lock on a chamber door does more than secure the door. It generates and maintains the compression force that presses the seal against the chamber body. That force must be uniform around the entire door perimeter and stable over thousands of operating cycles.
Single-point locks concentrate all compression force at one location, typically the handle side. The result is maximum seal compression near the lock, progressively decreasing toward the hinge side. Multi-point compression locks (three or more latching points distributed along the door edge) can reduce the resulting edge temperature gradient by an estimated 20% to 40%. That is a significant uniformity gain achieved purely through component selection.
Locking force decay is the hidden problem. Standard spring-loaded cam locks can lose 15% to 25% of their locking force within the first year of production use, as spring fatigue sets in and latch contact surfaces wear. This gradual loosening is invisible to operators — the door still feels closed — but the seal compression at the far edge from the lock has already degraded enough to permit micro-leakage.
Adjustable latching mechanisms that allow periodic re-calibration of locking force provide a practical countermeasure. At the higher end, self-adjusting compression locks automatically compensate for seal compression set over time, maintaining consistent gasket pressure across 0.5 mm to 1.5 mm of seal deformation without manual intervention.
Cable Ports and Access Openings — The Forgotten Leak Paths
Every penetration through a chamber wall is a potential thermal leak. Cable ports for sensor wiring, access holes for test fixtures, and viewport frames all interrupt the thermal boundary. The sealing components at these points receive far less attention than the door seal.
The standard cable port diameter on most chambers is approximately 2.4 inches (6.1 cm), sealed with a rubber or silicone plug. Over months of thermal cycling, rubber plugs harden and shrink. The process accelerates at both high-temperature and low-temperature extremes. A plug that fit tightly when new can develop a 0.5 mm annular gap after a year of service, creating a leak path that a thermal imaging camera will readily identify as a 3°C to 8°C local deviation.
Silicone port plugs outperform rubber in both temperature range and aging resistance. Multi-layer sealing assemblies, with an inner compression plug, a middle insulation layer, and an outer cap, provide redundant protection. The practical maintenance recommendation is simple: include cable ports and access openings in the quarterly door seal inspection routine. What shows up on the thermal camera at the ports is often more revealing than what you see at the door.
Most equipment specifications treat seals, hinges, locks, and port fittings as afterthoughts. But these four hardware categories are what determine whether a chamber maintains its as-built uniformity over years of service, or gradually drifts into non-compliance. When a chamber door no longer seals perfectly, every specification on the datasheet becomes irrelevant. The hardware that keeps that door closed, aligned, and uniformly compressed is not an accessory to the thermal system. It is the thermal system’s final, load-bearing link.
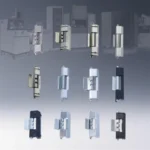
Secure Your Chamber’s Thermal Boundary with KUNLONG Hardware
For environmental test chambers and industrial ovens, standard hardware isn’t enough. With nearly 20 years of expertise and over 20,000 global clients, KUNLONG engineers structural components (locks, hinges, and handles) designed specifically to eliminate thermal bridging and sealing failures.
- Extreme Tolerance: Hardware and medical-grade silicone components rated for continuous service from -70℃ to +260℃, enduring 1000+ hours of salt spray testing.
- Uncompromising Precision: Error margins strictly controlled to 0.0005mm, backed by a 20,000+ open-close cycle guarantee to prevent latching force decay.
- Rapid Customization: Free 3D CAD downloads, custom 3D models within 7 days, and fast-track sampling to match your specific chamber geometry perfectly.
Upgrade your chamber’s final load-bearing link.
Email: yuki@kunlong.net
Phone: +86 18024916751 | Tel: 86-769-22687696
Verifying and Maintaining Long-Term Temperature Uniformity
Understanding what breaks uniformity is useful. Knowing how to verify it and keep it verified over years of operation is what separates a reliable process from a recurring headache.
Verification Methods
Temperature mapping is the standard verification method. Per DIN 12880, 9 to 27 calibrated thermocouples are placed in a three-dimensional grid throughout the working volume, and temperature data is recorded at steady state. The difference between the highest and lowest readings at any given time is the uniformity figure.
IEC 60068-3-7:2020 specifies that mapping should be performed both unloaded and with a representative load, since specimen loading changes airflow and heat distribution. For chambers used in aerospace applications, AMS 2750 mandates periodic Temperature Uniformity Surveys (TUS) at intervals determined by the furnace class. More stringent classes require more frequent re-survey.
In China, JJF 1101-2003 provides the calibration specification for environmental test equipment, using a 9-point or 27-point measurement method consistent with international practice.
Maintenance Checklist
Uniformity degrades gradually. The following maintenance cadence catches problems before they become failures:
The automotive maintenance analogy holds: you do not wait for the timing belt to snap before replacing it. Temperature uniformity deserves the same preventive discipline. The cost of finding a uniformity failure during a customer audit or a batch quality investigation is orders of magnitude higher than the cost of the maintenance that prevents it.
References
- IEC. “IEC 60068-3-7:2020 — Environmental testing — Part 3-7: Supporting documentation and guidance — Measurements in temperature chambers.” 2020. https://webstore.iec.ch/en/publication/63798
- SAE International. “AMS 2750 — Pyrometry.” Current edition. https://www.sae.org/standards/content/ams2750/
- Standardization Administration of China. “GB/T 10586-2025 — Technical Specifications for Humidity and Heat Test Chambers.” 2025.
- ASTM International. “ASTM E145 — Standard Specification for Gravity-Convection and Forced-Ventilation Ovens.” Current edition.
- Deutsches Institut für Normung. “DIN 12880 — Electrical laboratory devices — Heating ovens and incubators.” Current edition.
- ICH. “ICH Q1A(R2) — Stability Testing of New Drug Substances and Products.” 2003. https://www.ich.org/page/quality-guidelines
- NIST. “Gregory F. Strouse — Temperature Metrology.” National Institute of Standards and Technology. https://www.nist.gov/people/gregory-f-strouse
- U.S. FDA. “21 CFR Part 211 — Current Good Manufacturing Practice for Finished Pharmaceuticals.” https://www.accessdata.fda.gov/scripts/cdrh/cfdocs/cfcfr/CFRSearch.cfm?CFRPart=211